
Sankeys And Pythons And Pandas, Oh My
Recently I’ve seen a few people publishing Sankey diagrams (those coloured process diagrams) for their recent job searches. After finding it (initially) more of a faff to produce my own than I might have hoped I developed a tool to make this a bit easier. I thought that other people might also find this useful and so I am sharing it. Code is on my GitHub at Sankey-Pandas-Jobhunting-CSV-Processor. If you just want to use the utility then head over there- the following is the backstory.
Background
Back in March 2024 I was laid off along with ten other engineers/developers by my then employer. As I realised, this was one of the toughest seasons in the job market in recent memory. Everywhere and every day I have been reading about people, some highly skilled and whom I’ve worked with in the past, being suddenly laid off and taking months, sometimes with hundreds of applications, before finding something. Since April, with the new financial year, things seem to have picked up a little and I’ve seen a couple of posts from people publishing Sankey diagrams of their job hunting history on LinkedIn. I wanted to be able to visualise my search too.
Starting points
I was already recording my activity in Google Sheets, where I was using conditional formatting, filters and formulae (e.g. transitioning stale applications to ‘ghosted’ based on date) to apply some sanity to a volume of info I needed to hand, so I ‘had’ the data. My spreadsheet had:
- Column headers in the first row
- One row per job applied for
- Numerous columns, only some of which would have an entry in any given case, e.g. if rejected at ‘application’ stage then there would be nothing on that row in the ‘First interview’ column. Where there was an entry this was typically a date.
- Some rows that were ‘diary updates’, i.e. were not a job application and needed to be disregarded
- For my Sankey diagram I would only need to consider a subset of columns and whether there was any entry or not in each column by row.
How to process it however? SankeyMATIC seemed the popular choice and looked straightforward and pleasant enough.
My solution
After some brief and unsuccessful playing around with Google sheets formulas I elected to download a copy of my Google spreadsheet on demand at reporting time as a CSV since this is a common interchange format that any spreadsheet application and featureful programming language can deal with. I then used pandas (Python) to process this and give an output that can be used with Sankeymatic. Since I (now) wanted to share this with others I extended my solution to include an interactive file picker and options to produce a graphical output locally, with no requirement for online services.
Strengths
- This can work with any spreadsheet application, e.g. Google Sheets; Microsoft Excel; LibreOffice Calc; etc
- You can pick your CSV from within the script interface
- Since we are working with named columns, as long as these are present then you can have any other columns that you like.
- You can choose custom outcomes
- Because text is normalised to ‘Title Case’ you don’t have to worry about duplicating the same thing in different cases in your spreadsheet.
- SankeyMATIC is free of charge but there is also the facility to generate your sankey diagram locally
Weaknesses
- This does require willingness to use the terminal and Python at a basic level.
- Because we are using the column headers as labels in our code these have to match with the input spreadsheet. If you want custom labels then you will have to update the code to match! (I have included a sample CSV in the code).
The results
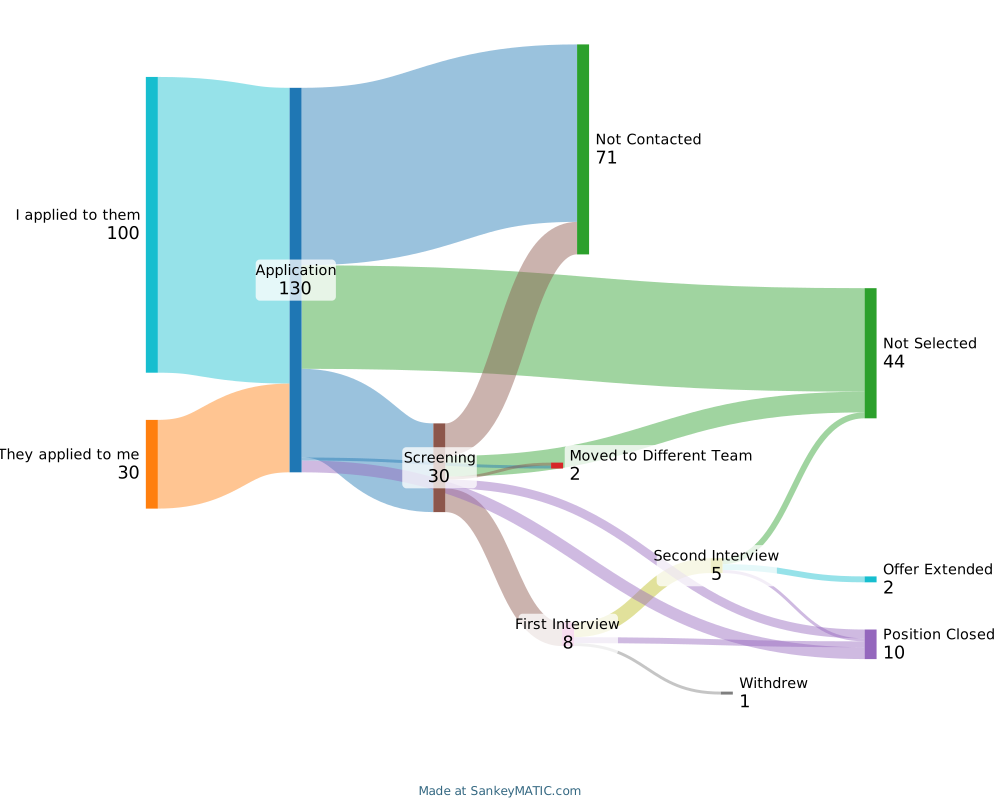
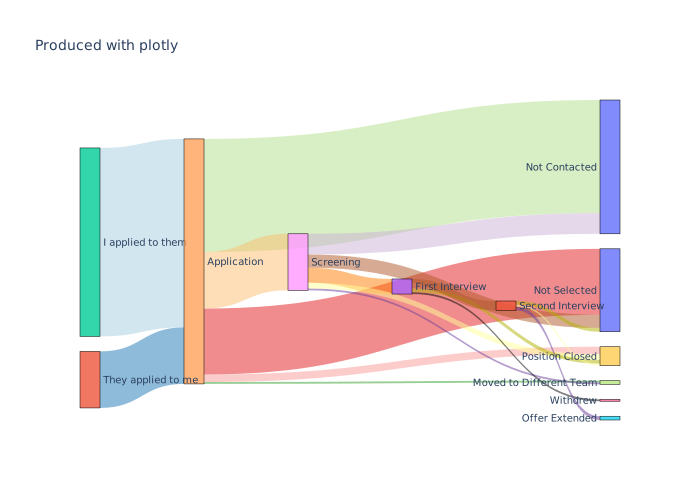
N.B. Below values are fuzzed/synthetic. Whilst representative they do not illustrate figures from an actual job search
Sample diagram using SankeyMATIC
Sample diagram using plotly with same data
And Finally
Good luck with your own Job hunt!